Earth and Space Sciences Regents, June 2025, question 9
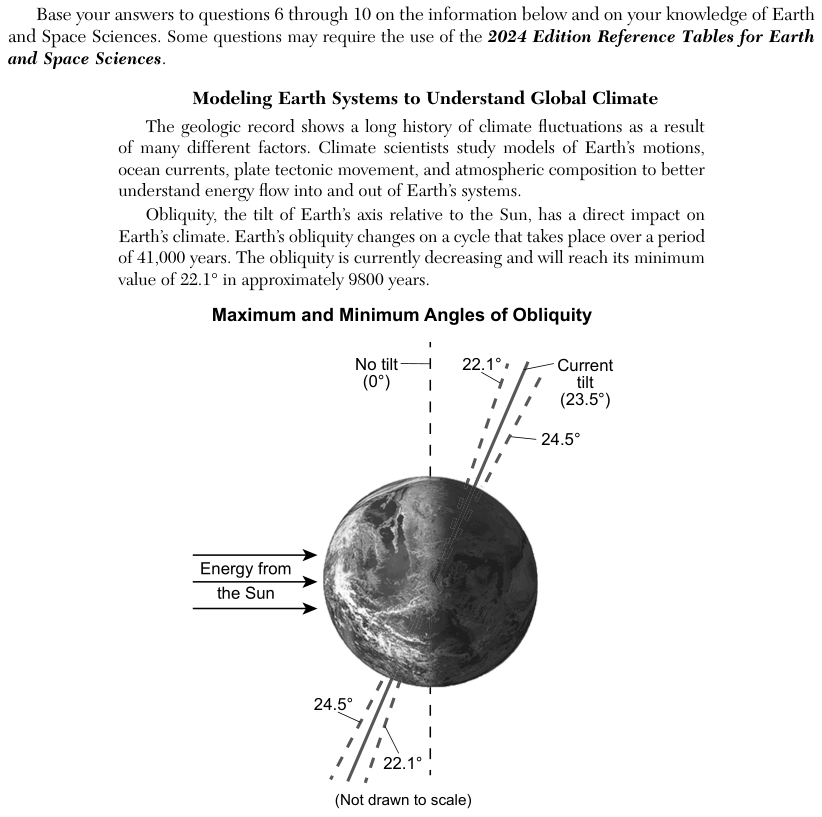
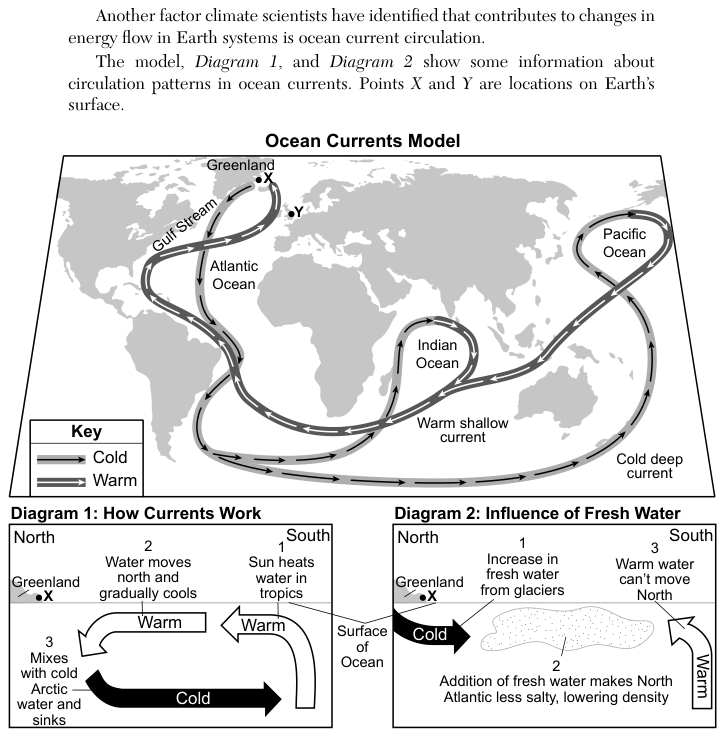
Tap an image to open it full size.
What the figure shows
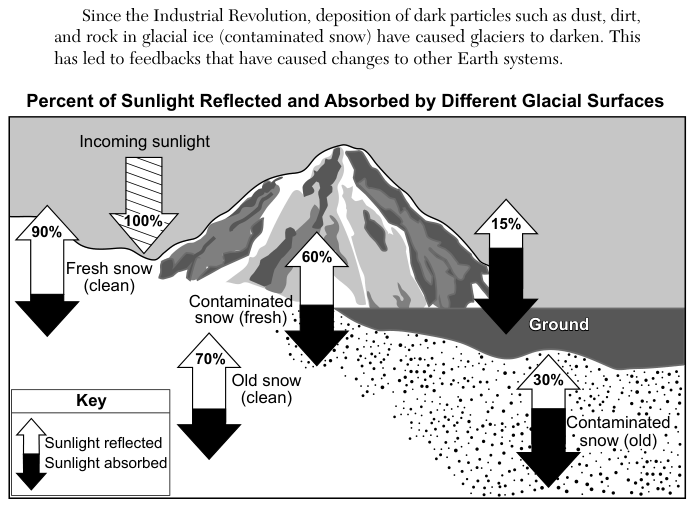
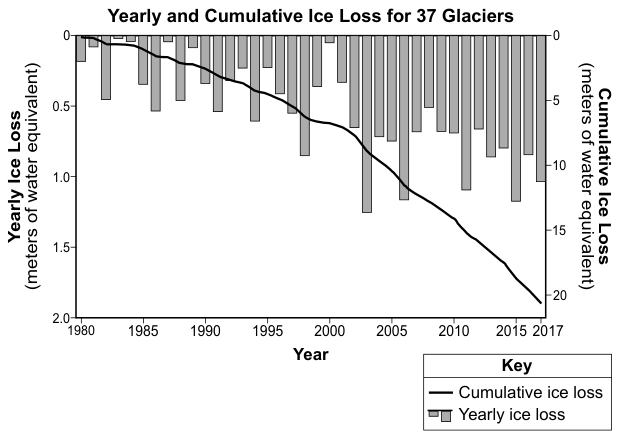
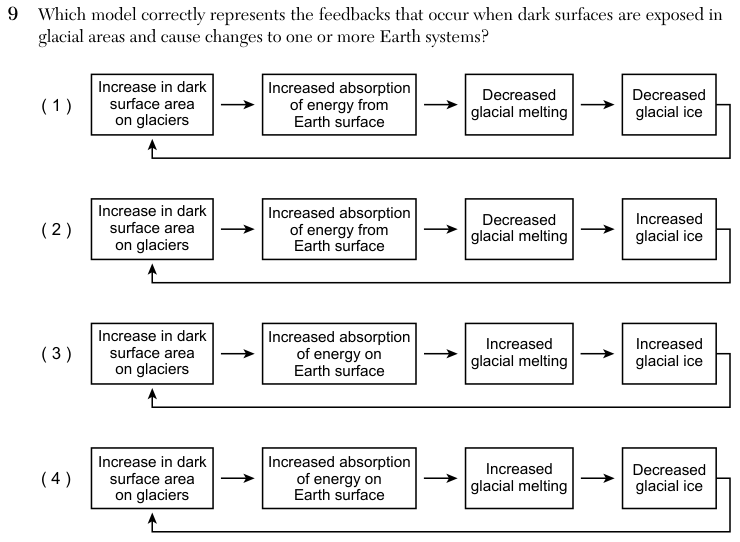
The passage says that since the Industrial Revolution, dark particles such as dust, dirt and rock have made glacier surfaces darker. The diagram "Percent of Sunlight Reflected and Absorbed by Different Glacial Surfaces" starts with 100% incoming sunlight and gives the share reflected by each surface: fresh clean snow 90%, old clean snow 70%, fresh contaminated snow 60%, old contaminated snow 30%, and bare ground 15%; the rest is absorbed. A graph, "Yearly and Cumulative Ice Loss for 37 Glaciers", shows yearly ice loss as bars (0 to 2.0 meters of water equivalent) and total ice loss as a line (0 to about 21 meters of water equivalent) from 1980 to 2017, with the total rising every year. The four answer choices are flow charts; each is a loop of four boxes whose last box points back to the first.
How to think about it
Follow one step at a time and ask what each step causes. Use the diagram to decide what happens to the energy when a surface becomes darker, then decide what that energy does to the ice. Finally, check that the last box would lead back to the first box, because a feedback loop must feed into its own start.
Which model correctly represents the feedbacks that occur when dark surfaces are exposed in glacial areas and cause changes to one or more Earth systems?