Earth and Space Sciences Regents, June 2025, question 41
Tap an image to open it full size.
What the figure shows
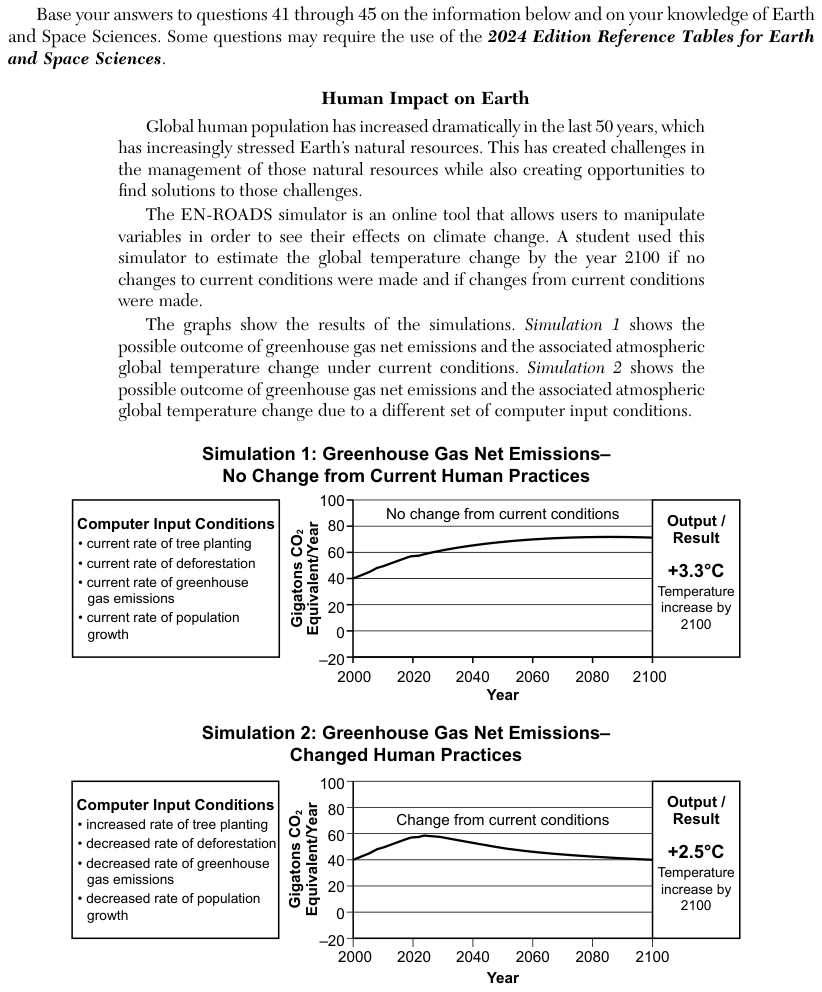
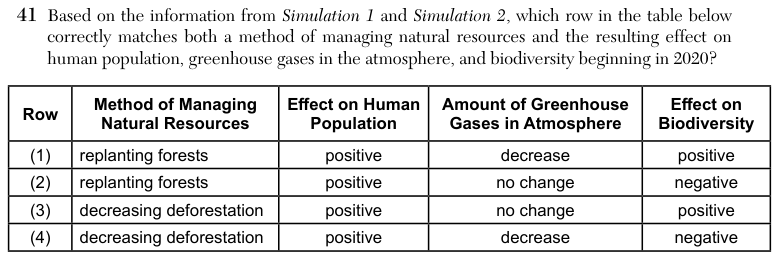
The passage describes a student who used a climate simulator to compare two futures. Simulation 1, no change from current human practices, keeps current rates of tree planting, deforestation, greenhouse gas emissions and population growth. Its greenhouse gas net emissions rise from about 40 gigatons of carbon dioxide (CO2) equivalent per year in 2000 to about 70 and stay near that level, with a temperature increase of +3.3 degrees Celsius (°C) by 2100. Simulation 2, changed human practices, uses an increased rate of tree planting, a decreased rate of deforestation, a decreased rate of greenhouse gas emissions and a decreased rate of population growth. Its net emissions peak near 58 gigatons per year around 2025 and fall to about 40 by 2100, with a temperature increase of +2.5°C by 2100. The answer table lists a method of managing natural resources and its effect on human population, greenhouse gases in the atmosphere and biodiversity.
How to think about it
Compare the input conditions of the two simulations to see which methods were changed, then compare the two emission curves and the two temperature results from 2020 onward. Ask how more trees, or fewer trees cut down, would change carbon dioxide and the living things in a forest. A row must be right in all four columns.
Based on the information from Simulation 1 and Simulation 2, which row in the table below correctly matches both a method of managing natural resources and the resulting effect on human population, greenhouse gases in the atmosphere, and biodiversity beginning in 2020? Row Method of Managing Natural Resources Effect on Human Population Amount of Greenhouse Gases in Atmosphere Effect on Biodiversity