Earth and Space Sciences Regents, June 2025, question 43
Tap an image to open it full size.
What the figure shows
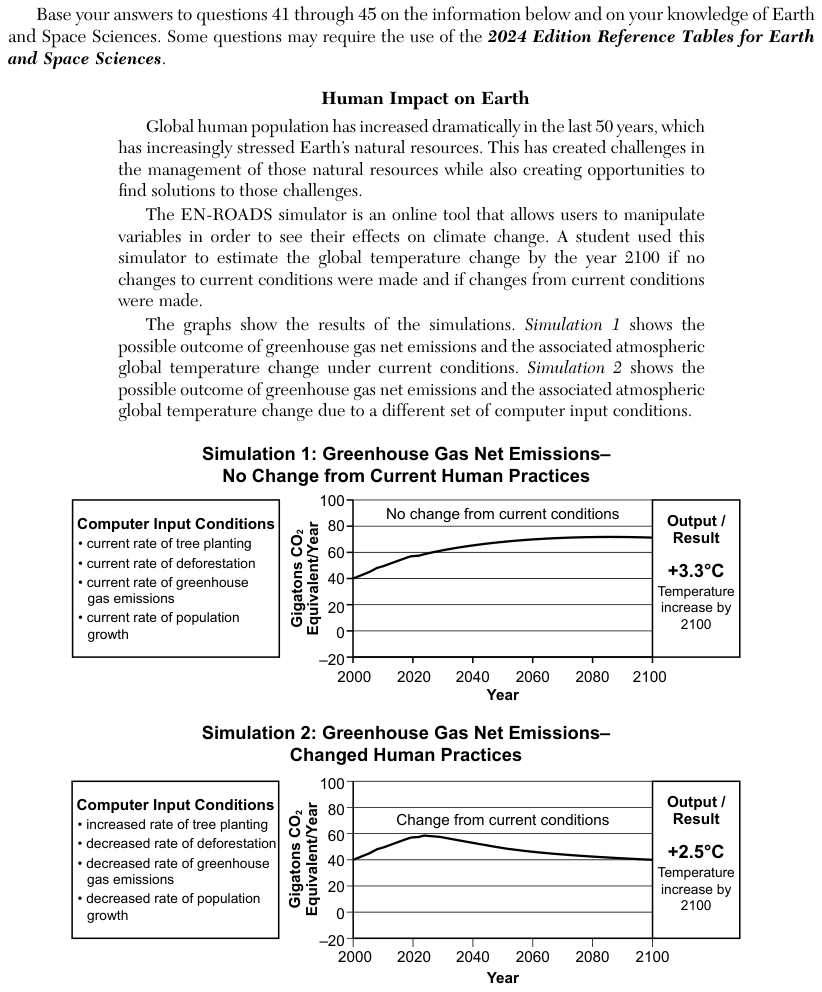
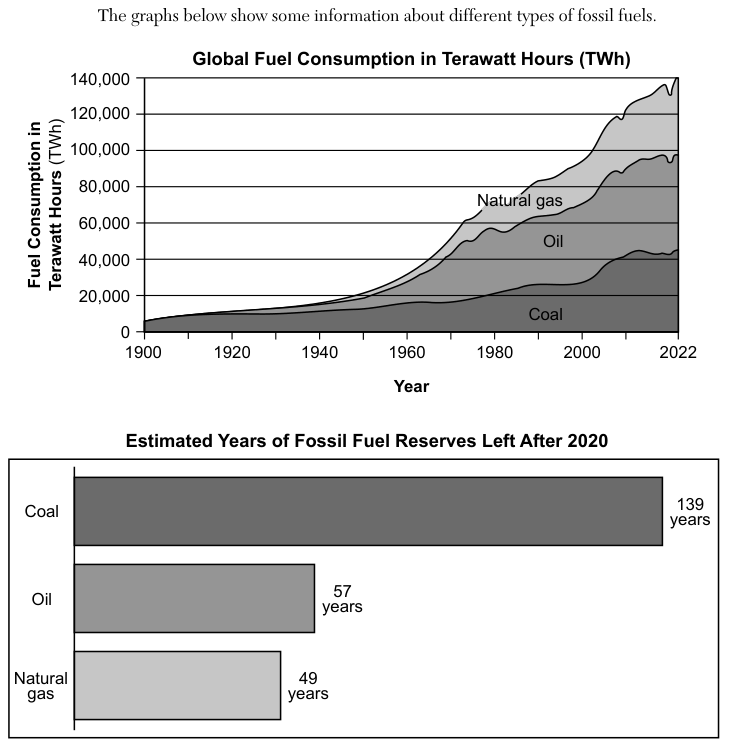
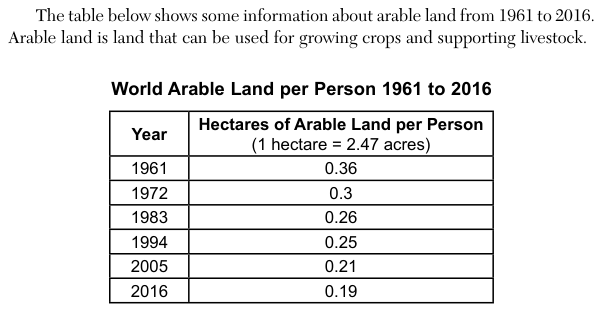
Two simulations show greenhouse gas net emissions, in gigatons of carbon dioxide (CO2) equivalent per year, from 2000 to 2100. With no change from current practices, emissions rise from about 40 to about 70 gigatons and the printed result is a temperature increase of +3.3 degrees Celsius (°C) by 2100; with changed practices, emissions peak near 60 gigatons and fall back to about 40, and the printed result is +2.5°C. A graph shows global fossil fuel consumption rising from 1900 to 2022, and a table, World Arable Land per Person 1961 to 2016, lists 0.36, 0.3, 0.26, 0.25, 0.21 and 0.19 hectares per person (1 hectare = 2.47 acres). Arable land is land that can be used for growing crops and supporting livestock.
How to think about it
Follow the chain one link at a time. The graphs link burning fossil fuels to greenhouse gas emissions and a rise in temperature. Then think about what warmer air does to the water held in soil, and check the table to see which way the amount of arable land per person changed.
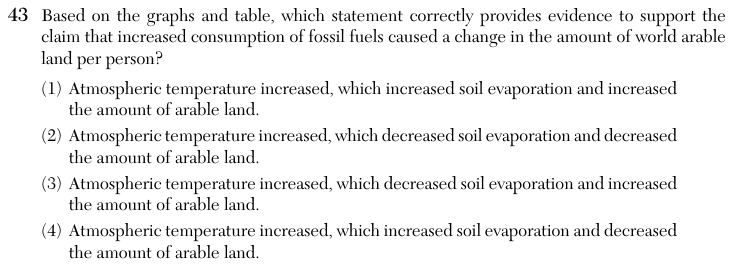
Based on the graphs and table, which statement correctly provides evidence to support the claim that increased consumption of fossil fuels caused a change in the amount of world arable land per person?
Choice 4 is right. Burning more fossil fuels adds greenhouse gases, and the simulations show that more emissions lead to a higher global temperature. Warmer air causes more water to evaporate from soil. Drier soil can make some land less suitable for crops. The table shows arable land per person falling from 0.36 hectares in 1961 to 0.19 hectares in 2016. Population growth alone would also make this number fall, so the table supports the trend but does not by itself prove that land was lost.
Higher temperature does increase soil evaporation, but drier soil does not create more farmland. The table also shows arable land per person decreasing, not increasing.
Higher temperature increases evaporation from soil; it does not decrease it. This choice may come from linking warmth with less water loss instead of more.
Both later links are reversed. Warmer temperatures increase soil evaporation, and the table shows arable land per person decreasing from 1961 to 2016.