Earth and Space Sciences Regents, August 2025, question 10
Tap an image to open it full size.
What the figure shows
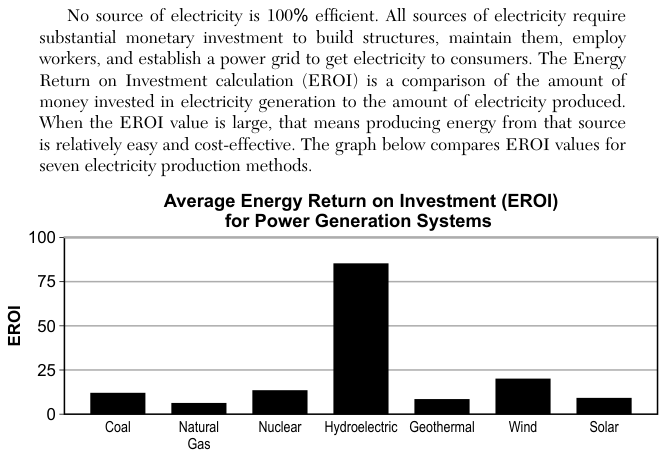
The passage says the Energy Return on Investment (EROI) compares the money invested in electricity generation to the amount of electricity produced, and that a large EROI means producing energy from that source is relatively easy and cost-effective. The bar graph Average Energy Return on Investment (EROI) for Power Generation Systems has EROI from 0 to 100 on the vertical axis, with lines every 25. The bars read about: coal 12, natural gas 6, nuclear 13, hydroelectric 85, geothermal 8, wind 20, solar 9.
How to think about it
First sort the seven sources into renewable and nonrenewable, using what you know about where each one gets its energy. Then read the height of each bar against the lines at 25, 50, 75 and 100. Test each statement with those readings, and for a statement about how many times greater, divide one value by the other.
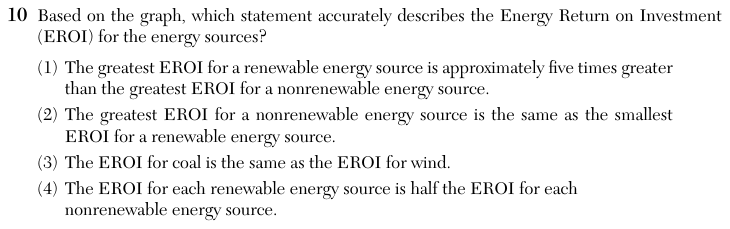
Based on the graph, which statement accurately describes the Energy Return on Investment (EROI) for the energy sources?
Choice 1 is right. The greatest EROI for a renewable source is hydroelectric, about 85. The greatest EROI for a nonrenewable source is nuclear, about 13, with coal close behind at about 12. 85 divided by 13 is about 6.5, so the printed "approximately five times" is a loose approximation. The other three statements are clearly false. Choice 1 is loose, but it is still the only statement that is not clearly false.
The greatest nonrenewable EROI is nuclear, about 13. The smallest renewable EROI is geothermal, about 8, with solar about 9. These values are not the same. This choice may come from seeing several short bars of similar height and treating them as equal without reading them against the grid lines.
Coal is about 12 and wind is about 20, so wind is clearly higher. This choice may come from reading the two short bars without checking them against the 25 line.
The renewable sources do not share one EROI, and none is half of every nonrenewable value. Hydroelectric (about 85) and wind (about 20) are higher than all three nonrenewable sources, while geothermal and solar are close to coal and natural gas. This choice may come from noticing that some renewable bars are shorter than some nonrenewable bars and applying that to every source.