Earth and Space Sciences Regents, January 2026, question 41
Tap an image to open it full size.
What the figure shows
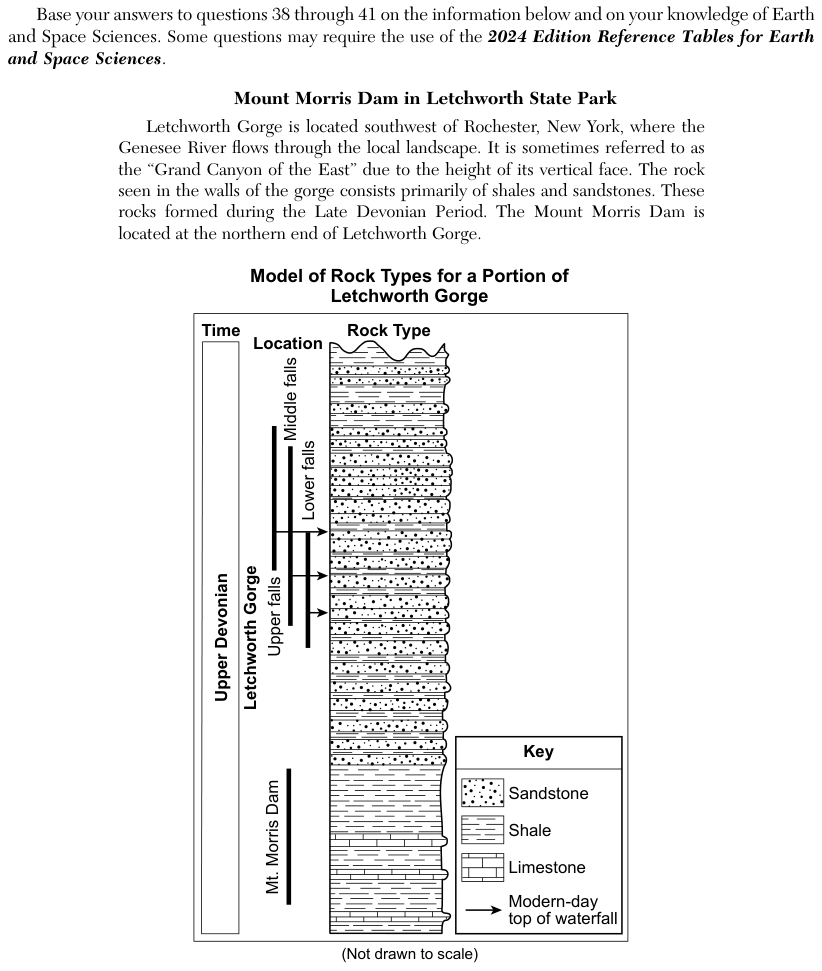
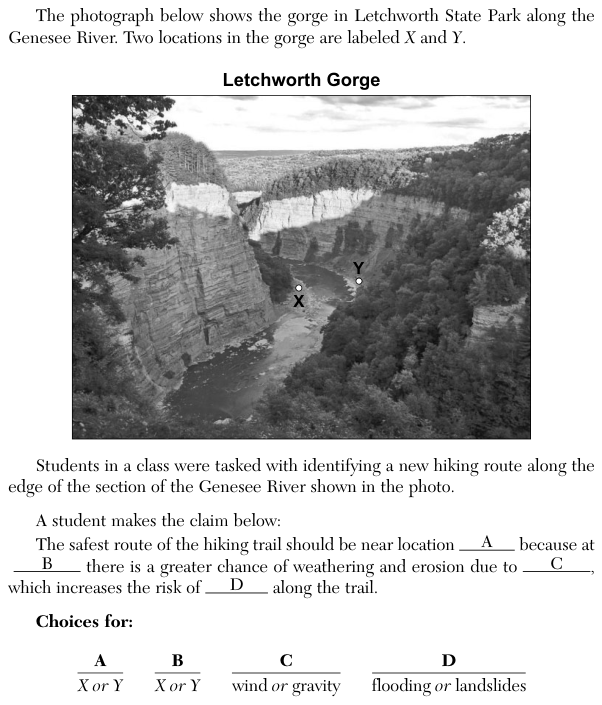
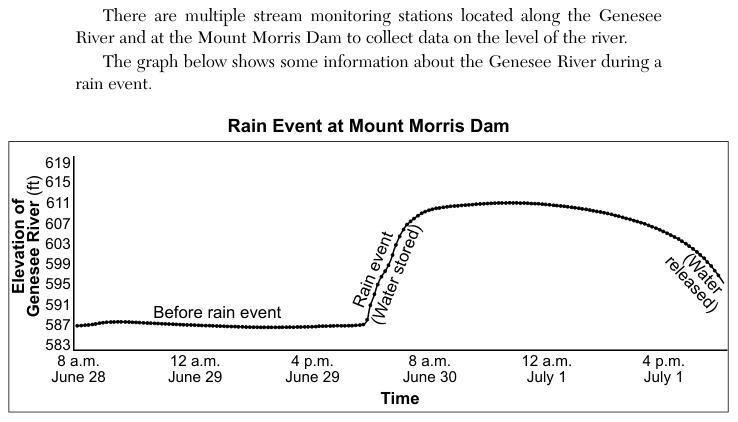
The passage says the gorge is southwest of Rochester, New York, the Genesee River flows through it, and the Mount Morris Dam is at the northern end of the gorge. Stream monitoring stations along the river and at the dam collect data on the river level. The graph Rain Event at Mount Morris Dam plots the Elevation of the Genesee River in feet (583 to 619) against Time from 8 a.m. June 28 to about 8 p.m. July 1. Before the rain event the level stays near 587 feet. During the rain event, labelled "Water stored", it rises to about 611 feet by early June 30, stays near that level until about 12 a.m. July 1, and then falls slowly, labelled "Water released", to about 595 feet by the end of the graph.
How to think about it
Follow the line on the graph: what happens to the water behind the dam during the rain, and how fast is it let go afterwards? Then think about what would happen to the river downstream if all that rainwater had flowed on at once. Check that the statement you pick is about controlling rain events, as the stem asks.
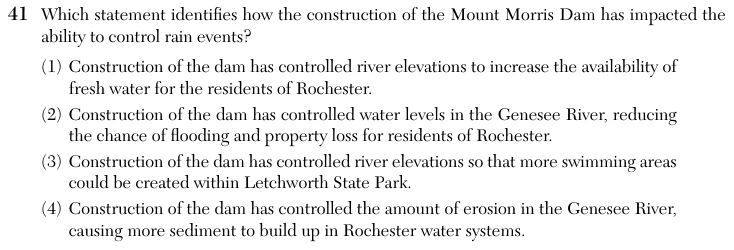
Which statement identifies how the construction of the Mount Morris Dam has impacted the ability to control rain events?
Choice 2 is right. During the rain event the dam held back the extra water, so the river level behind it rose from about 587 feet to about 611 feet. The dam then let the water out gradually over the remaining hours shown on the graph. Because the water reaches the river downstream a little at a time instead of all at once, the chance of flooding and property loss in Rochester, downstream to the north, is lower.
A reservoir can store fresh water, but the graph is about holding and releasing water during a rain event, not about the supply of drinking water. This choice does not answer how the dam controls rain events.
Swimming areas are a recreation use, not a way of controlling rain events. Nothing in the passage or the graph is about swimming. This choice may come from confusing a reservoir's recreation uses with the flood-control purpose the graph documents.
A dam slows the river, so sediment settles in the still water behind the dam instead of moving downstream. This choice reverses that effect, and erosion is not what the graph shows the dam controlling.