Earth and Space Sciences Regents, June 2026, question 27
Tap an image to open it full size.
What the figure shows
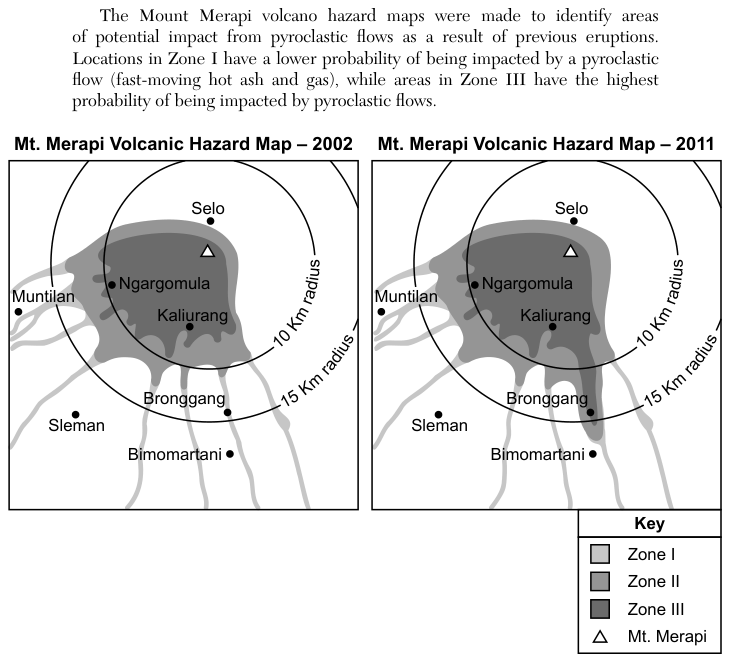
The passage says the Mount Merapi hazard maps show areas of possible impact from pyroclastic flows (fast-moving hot ash and gas). Zone I has a lower probability of being impacted and Zone III the highest. Two maps, dated 2002 and 2011, show Mt. Merapi with circles of 10 kilometers (km) and 15 km radius around it, and the towns Selo, Ngargomula, Kaliurang, Muntilan, Sleman, Bronggang and Bimomartani. Shaded Zones I, II and III spread mostly to the west and south of the volcano along valleys; Muntilan lies outside the 15 km circle, and on the 2011 map a shaded zone reaches farther south, to Bronggang. The question lists five statements, and each choice names three of them.
How to think about it
Test each of the five statements against the two maps on its own. Compare the zone each town falls in on the 2002 map and on the 2011 map, measure each town against the 10 km and 15 km circles, and look at which directions the shaded zones extend from the volcano. Then find the choice that lists only the statements the maps support.
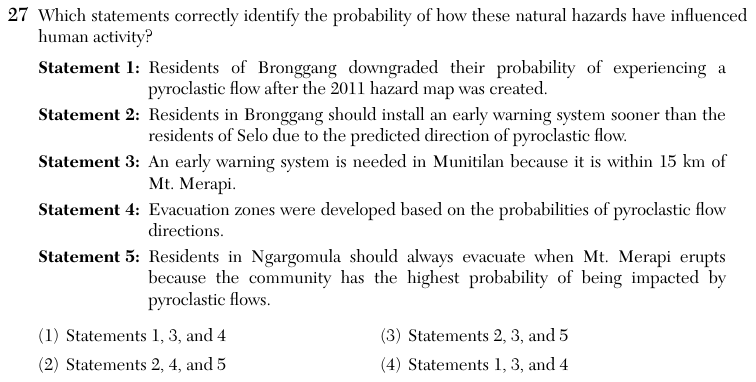
Which statements correctly identify the probability of how these natural hazards have influenced human activity? Statement 1: Residents of Bronggang downgraded their probability of experiencing a pyroclastic flow after the 2011 hazard map was created. Statement 2: Residents in Bronggang should install an early warning system sooner than the residents of Selo due to the predicted direction of pyroclastic flow. Statement 3: An early warning system is needed in Munitilan because it is within 15 km of Mt. Merapi. Statement 4: Evacuation zones were developed based on the probabilities of pyroclastic flow directions. Statement 5: Residents in Ngargomula should always evacuate when Mt. Merapi erupts because the community has the highest probability of being impacted by pyroclastic flows.