Earth and Space Sciences Regents, June 2025, question 19
Tap an image to open it full size.
What the figure shows
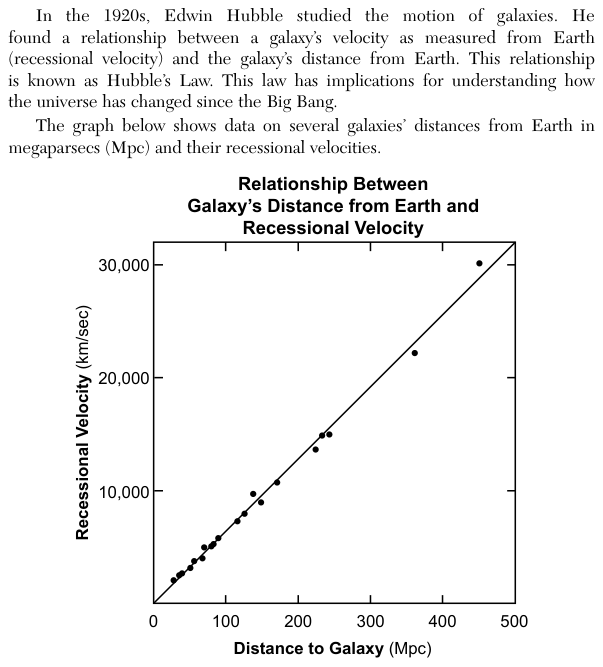
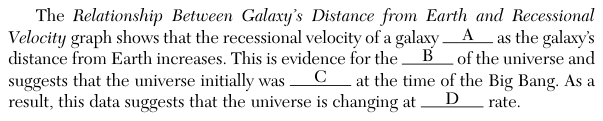
The graph Relationship Between Galaxy's Distance from Earth and Recessional Velocity plots distance to the galaxy in megaparsecs (Mpc), from 0 to 500, against recessional velocity (how fast the galaxy moves away from Earth) in kilometers per second (km/sec), from 0 to over 30,000. A line is drawn through the data points. A short passage has four blanks, A to D: how velocity changes with distance, what this is evidence for, what the universe was like at the time of the Big Bang, and the rate at which the universe is changing.
How to think about it
Look at the shape of the line first: is it straight and does it pass through zero, or does it curve? That settles blank A. Then think about what it means when distant galaxies all move away from us, and run that motion backward in time to fill blanks B and C. Fill each blank on its own before comparing tables.
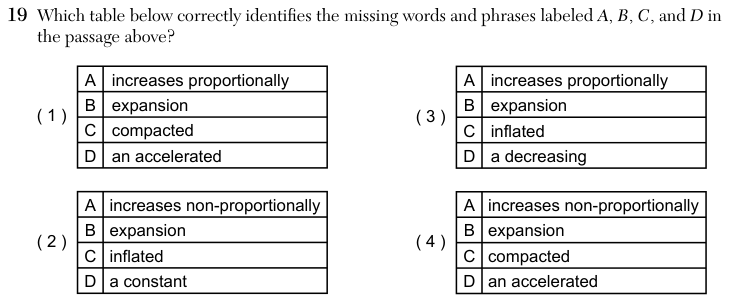
Which table below correctly identifies the missing words and phrases labeled A, B, C, and D in the passage above?
Choice 1 is right. The points fall on a straight line through the origin, so velocity increases proportionally with distance (A). Galaxies moving away from us in every direction is evidence for the expansion of the universe (B). Run backward in time, all matter was packed together, so the universe was compacted at the time of the Big Bang (C). The exam links this to a universe changing at an accelerated rate (D); that acceleration is supported by other observations of distant exploding stars.
This choice misreads the straight line as a curve, so A is wrong. It also reverses C: run backward, an expanding universe was smaller and denser, not inflated. For D, a straight line of velocity against distance, measured at one time, does not show how the rate changes over time. The evidence that the expansion is speeding up comes from separate observations of distant exploding stars.
A and B are correct, but C is reversed. An expanding universe was compacted in the past, not inflated. For D, observations of distant exploding stars show the expansion speeding up, not slowing down, so a decreasing rate is the opposite of what the evidence shows.
B, C and D match, but A misreads the graph. The points lie along a straight line through zero, so the increase is proportional, not non-proportional.