Earth and Space Sciences Regents, June 2025, question 20
Tap an image to open it full size.
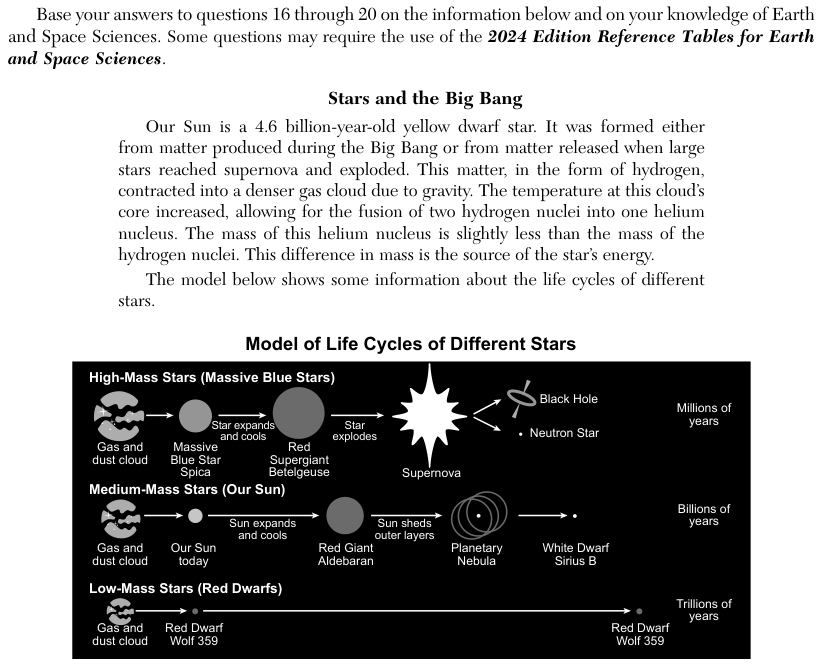
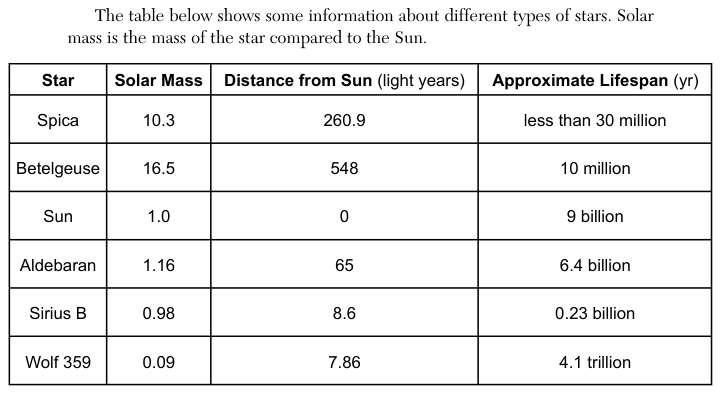
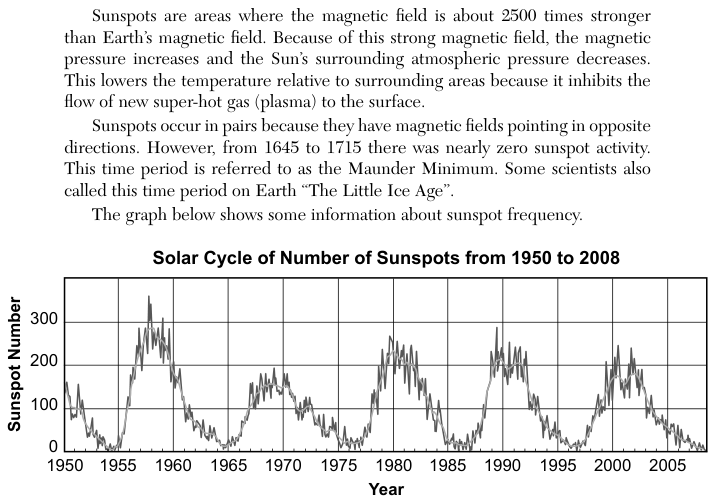
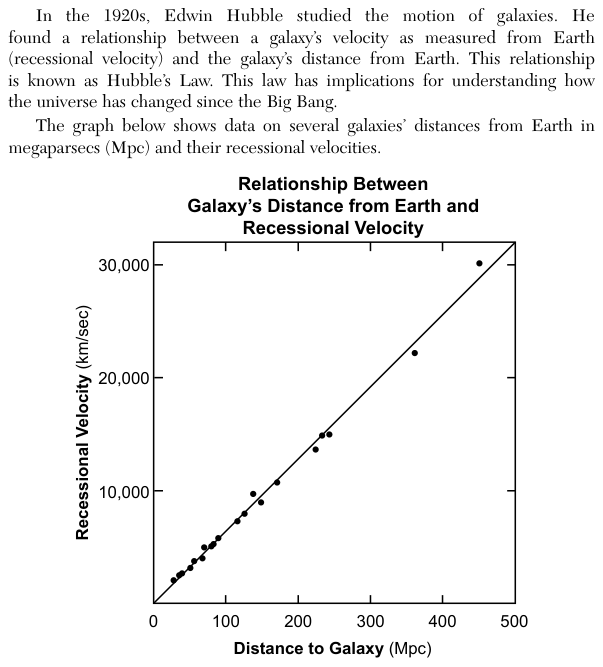
What the figure shows
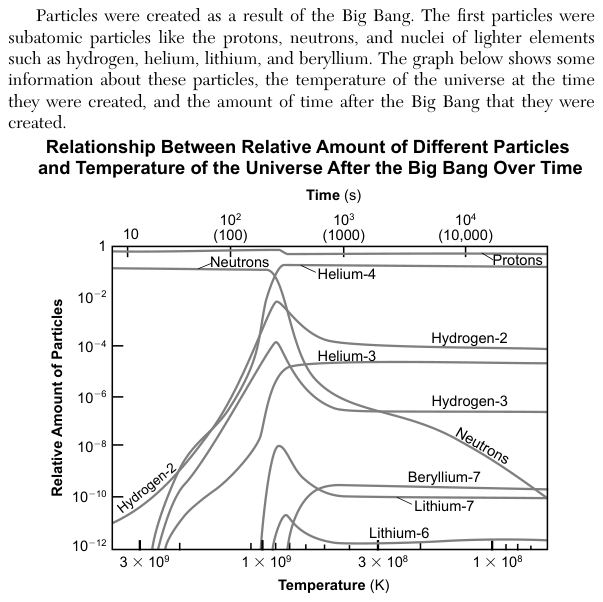
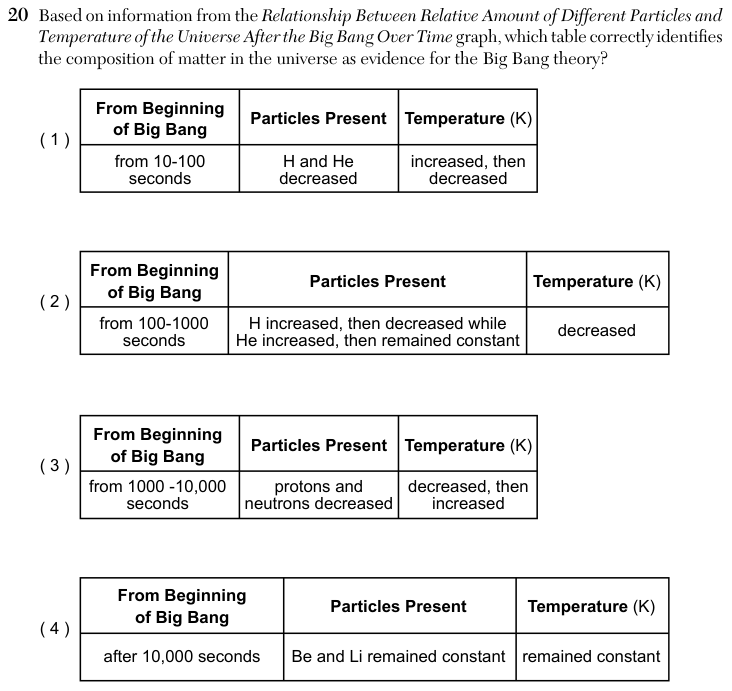
The graph Relationship Between Relative Amount of Different Particles and Temperature of the Universe After the Big Bang Over Time has two horizontal scales. The top axis is time after the Big Bang in seconds (s), from about 10 to over 10,000; the bottom axis is temperature in kelvin (K), which falls from left to right, from above 3 x 10^9 K to below 1 x 10^8 K. The vertical axis is the relative amount of particles on a logarithmic scale, from 10^-12 to 1. Curves are drawn for protons, neutrons, hydrogen-2, hydrogen-3, helium-3, helium-4, beryllium-7, lithium-7 and lithium-6. The question gives four tables, each with a time range, a change in particles and a change in temperature.
How to think about it
For each table, find the time range on the top axis, then follow the named curves across that range only. Read the temperature from the bottom axis and notice which way it runs. Check both columns of a table; a table is correct only if the particle change and the temperature change both match.
Based on information from the Relationship Between Relative Amount of Different Particles and Temperature of the Universe After the Big Bang Over Time graph, which table correctly identifies the composition of matter in the universe as evidence for the Big Bang theory? from 10-100 seconds H and He decreased increased, then decreased From Beginning of Big Bang from 1000 -10,000 seconds protons and neutrons decreased decreased, then increased Particles Present Temperature (K) From Beginning of Big Bang Particles Present Temperature (K)