Earth and Space Sciences Regents, January 2026, question 45
Tap an image to open it full size.
What the figure shows
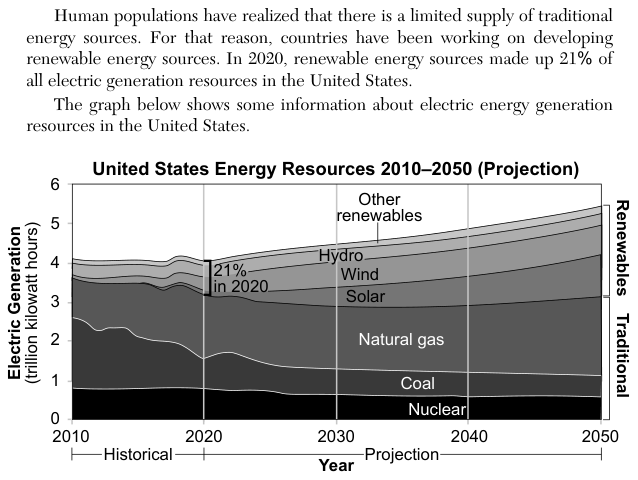
The passage says that in 2020 renewable energy sources made up 21% of all electric generation resources in the United States. The stacked area graph United States Energy Resources 2010–2050 (Projection) shows Electric Generation in trillion kilowatt hours (0 to 6) against Year, historical from 2010 to 2020 and projected from 2020 to 2050. From the bottom up the bands are Nuclear, Coal and Natural gas (bracketed as Traditional), then Solar, Wind, Hydro and Other renewables (bracketed as Renewables). A bracket at 2020 marks the renewables part as "21% in 2020".
How to think about it
In a stacked graph, the amount for one source is the thickness of its band, not the height of its top edge. Measure each band by subtracting its lower edge from its upper edge, and add the bands within a bracket to get a group total. Check the year each statement names.
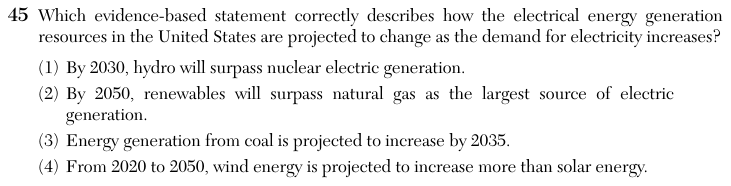
Which evidence-based statement correctly describes how the electrical energy generation resources in the United States are projected to change as the demand for electricity increases?
Choice 2 is right. In 2050 the renewables bracket runs from about 3.15 to 5.45 trillion kilowatt hours, a total of about 2.3. The natural gas band runs from about 1.1 to 3.15, or about 2.05. So by 2050 renewables together are projected to generate more electricity than natural gas, the largest single traditional source.
The hydro band stays thin, about 0.3 trillion kilowatt hours, while nuclear is about 0.6 in 2030. This choice may come from reading the height of the hydro label or of the top of its band instead of the band's thickness.
The coal band gets thinner after about 2022, so generation from coal is projected to decrease, not increase, by 2035.
The solar band grows from almost nothing in 2020 to about 1 trillion kilowatt hours in 2050, while the wind band grows by less than half of that. Solar, not wind, shows the larger increase. This may come from the wind band sitting higher on the graph.