Earth and Space Sciences Regents, August 2026, question 19
Tap an image to open it full size.
What the figure shows
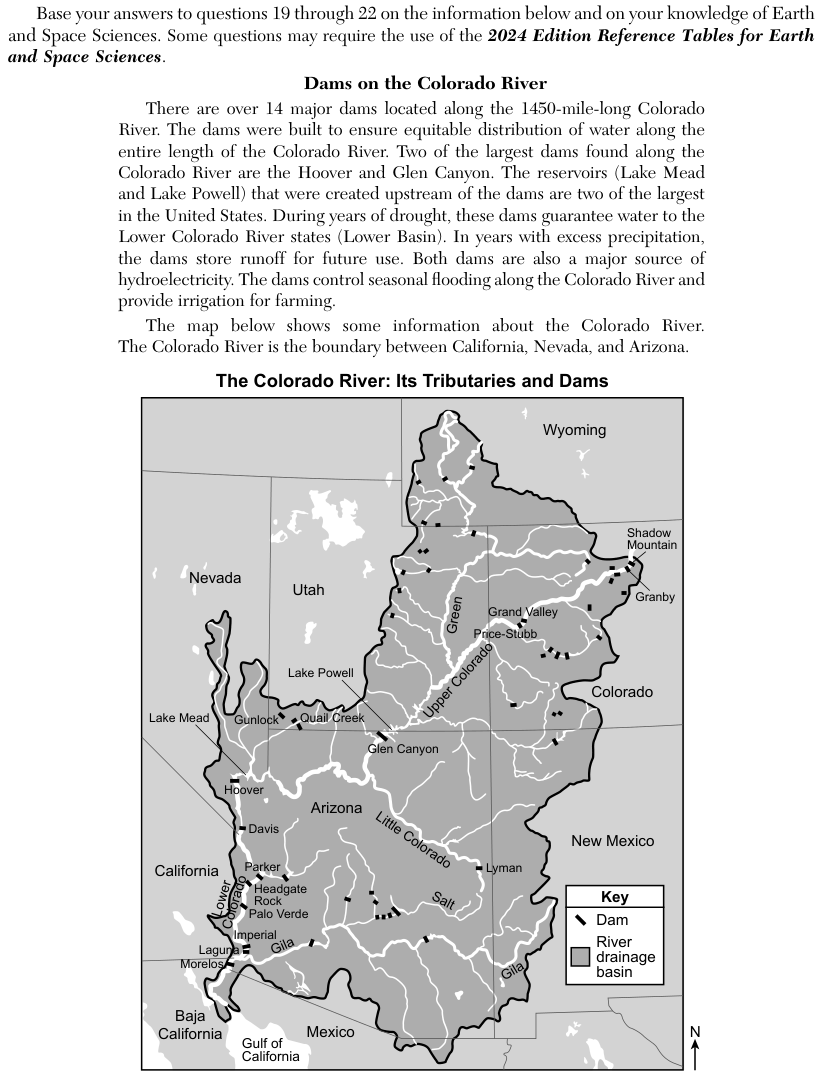
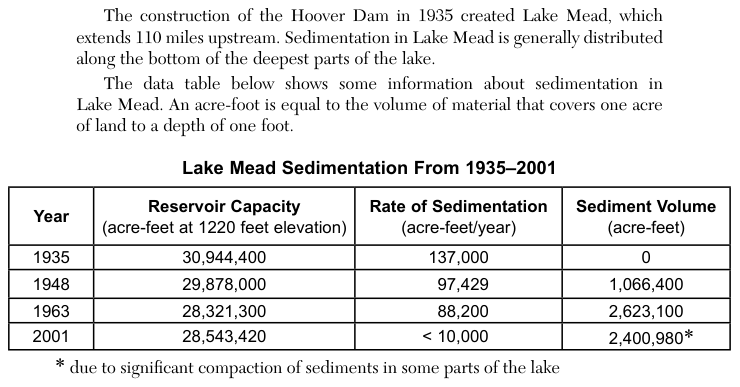
The passage says the Hoover Dam, built in 1935, created Lake Mead, which extends 110 miles upstream, and that sediment in Lake Mead is generally spread along the bottom of the deepest parts of the lake. A map shows the Colorado River, its tributaries and its dams, with Lake Mead behind the Hoover Dam. The table, Lake Mead Sedimentation From 1935-2001, gives four years. Rate of sedimentation in acre-feet per year: 137,000 (1935), 97,429 (1948), 88,200 (1963), less than 10,000 (2001). Sediment volume in acre-feet: 0 (1935), 1,066,400 (1948), 2,623,100 (1963), 2,400,980 (2001), with a note that the 2001 value reflects significant compaction of sediments in some parts of the lake.
How to think about it
Start with the Sediment Volume column and see how the amount of sediment stored in the lake changed after the dam was built. Then recall how the speed of moving water controls whether it carries sediment or drops it. Ask where along the river and the lake the speed of the water changes, and in which direction.
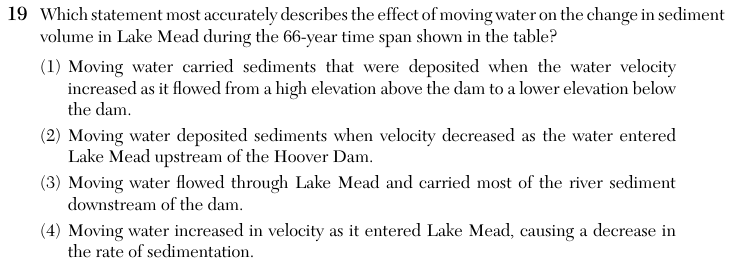
Which statement most accurately describes the effect of moving water on the change in sediment volume in Lake Mead during the 66-year time span shown in the table?
Choice 2 is right. When the Colorado River flows into Lake Mead, the water spreads out into deep, still water and its velocity drops. Slower water cannot carry as much sediment, so the sediment settles to the lake bottom. This is why the sediment volume in the lake grew from 0 in 1935 to more than 2 million acre-feet by 1963.
Sediment is deposited when water slows down, not when it speeds up. This choice reverses the link between velocity and deposition, and it places the deposition below the dam instead of in Lake Mead.
If most of the sediment had passed through the lake and below the dam, the sediment volume in Lake Mead would have stayed small. The table shows a large amount of sediment deposited in the lake, more than 2 million acre-feet by 1963. The share of the incoming sediment that stayed in the lake cannot be worked out from the table, because it does not give the total amount the river brought in.
Water slows down, not speeds up, as it enters a lake. The table does show the rate of sedimentation falling over time, but that fall may come from less sediment reaching the lake, for example sediment trapped behind dams farther upstream, and it is not caused by faster water.