Earth and Space Sciences Regents, August 2026, question 21
Tap an image to open it full size.
What the figure shows
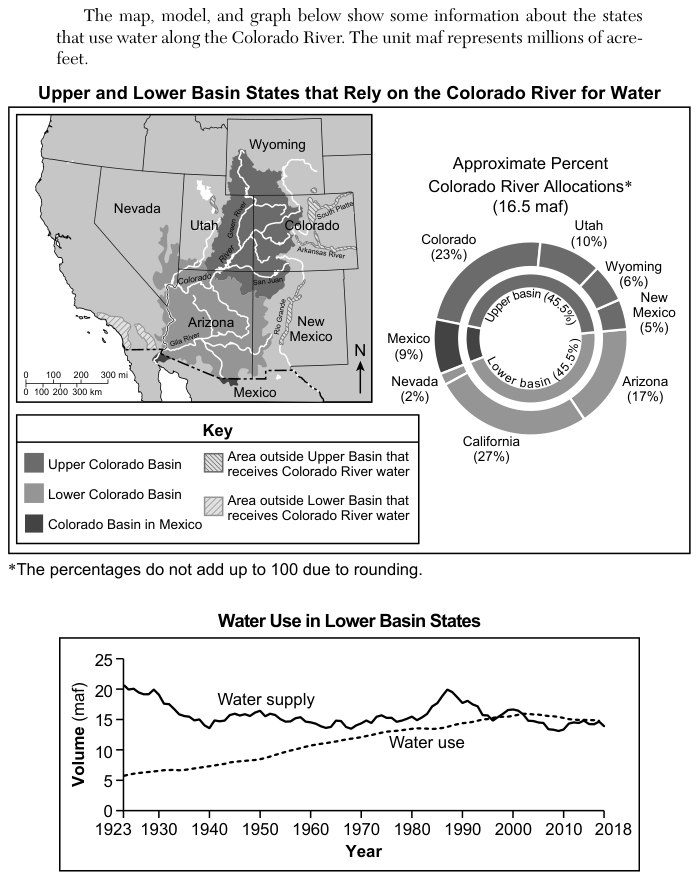
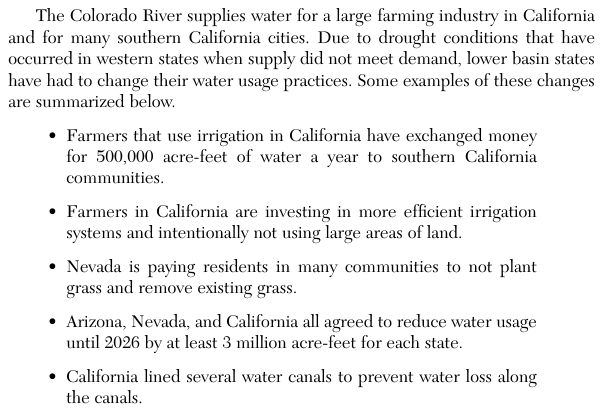
A ring chart, Approximate Percent Colorado River Allocations (16.5 million acre-feet, written maf), gives each user a share: Colorado 23%, Utah 10%, Wyoming 6%, New Mexico 5%, Arizona 17%, California 27%, Nevada 2%, Mexico 9%. A line graph, Water Use in Lower Basin States, plots volume in maf against year from 1923 to 2018. The water supply line starts near 20.5 maf, stays near 14 to 16 maf from about 1940 to 1980, peaks near 20 maf around 1987, and falls to about 14 maf by 2018. The water use line rises steadily from about 6 maf in 1923 to about 15 maf in 2018; the two lines come together in the late 1990s and early 2000s, and after about 2003 the water use line is at or above the water supply line. A list of changes made during drought says: California farmers exchanged money for 500,000 acre-feet of water a year to southern California communities; California farmers invest in more efficient irrigation and leave large areas of land unused; Nevada pays residents to not plant grass and remove existing grass; Arizona, Nevada and California agreed to reduce water usage until 2026 by at least 3 million acre-feet for each state; California lined several water canals to prevent water loss.
How to think about it
Each choice makes two or three separate claims: a date or number, and a human action. Check every claim against the source that holds it: dates against the Water Use in Lower Basin States graph, percentages against the ring chart, and actions and amounts against the list of changes. A statement is evidence-based only if every part of it matches.
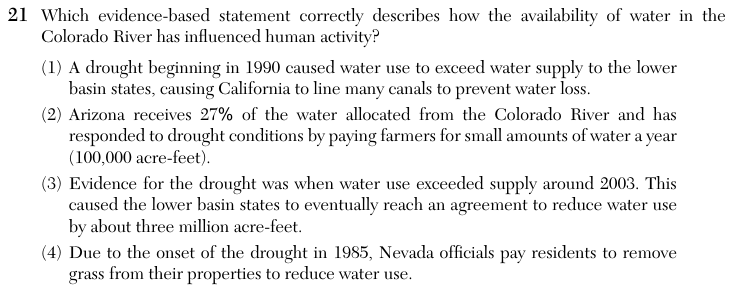
Which evidence-based statement correctly describes how the availability of water in the Colorado River has influenced human activity?
Choice 3 is right. On the graph, the water use line rises above the water supply line around 2003 and stays near or above it afterward. The list of changes says Arizona, Nevada and California agreed to cut water use by at least 3 million acre-feet for each state. Choice 3 gives the cut as about three million acre-feet and does not say for each state. Its date and its action match the evidence. The quantity does not match exactly: the list says at least 3 million acre-feet for each state, and that is far more than Nevada's 2 percent share of 16.5 million acre-feet (about 0.33 million acre-feet). Choice 3 is still the only choice whose date and action both fit.
California did line canals, but the graph does not support the date. Around 1990 the water supply was still near its peak and well above water use. This choice may come from reading the fall in supply after 1987 as the point where use passed supply.
The ring chart gives Arizona 17% of the allocation; 27% is California's share. The list says California farmers sold 500,000 acre-feet a year, and no Arizona payment of 100,000 acre-feet appears. This choice mixes up the two states and their numbers.
Nevada does pay residents to remove grass, but 1985 was not the start of a drought. On the graph the water supply was rising toward its highest value near 1987 at that time.