Earth and Space Sciences Regents, August 2025, question 4
Tap an image to open it full size.
What the figure shows
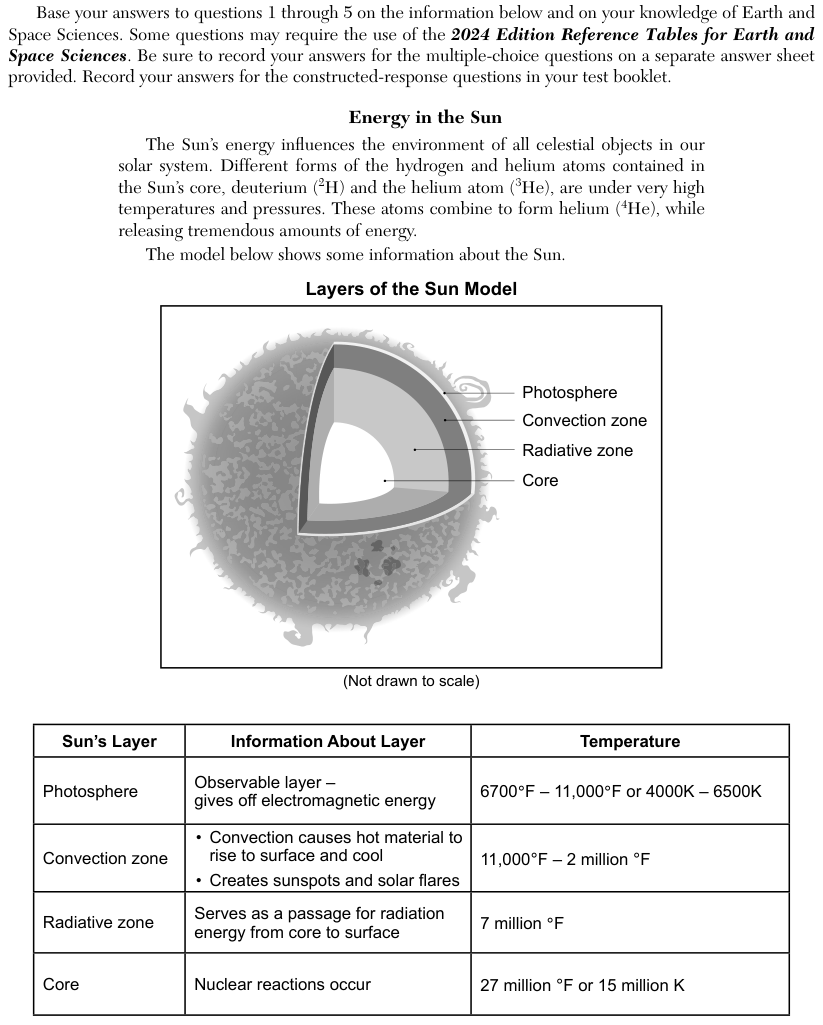
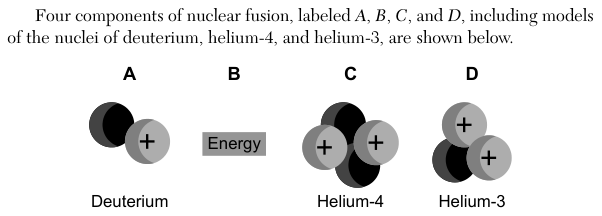
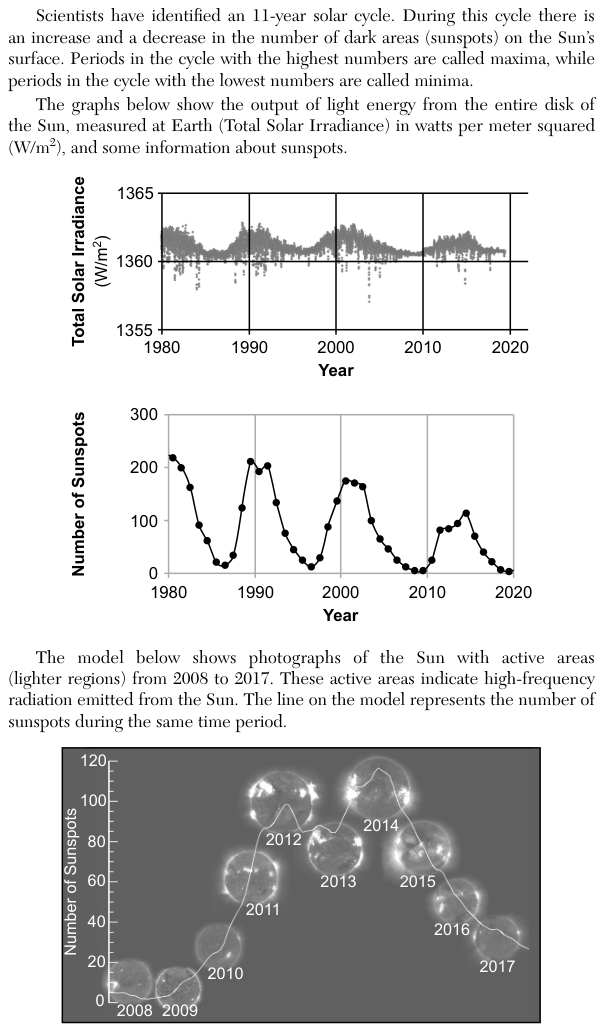
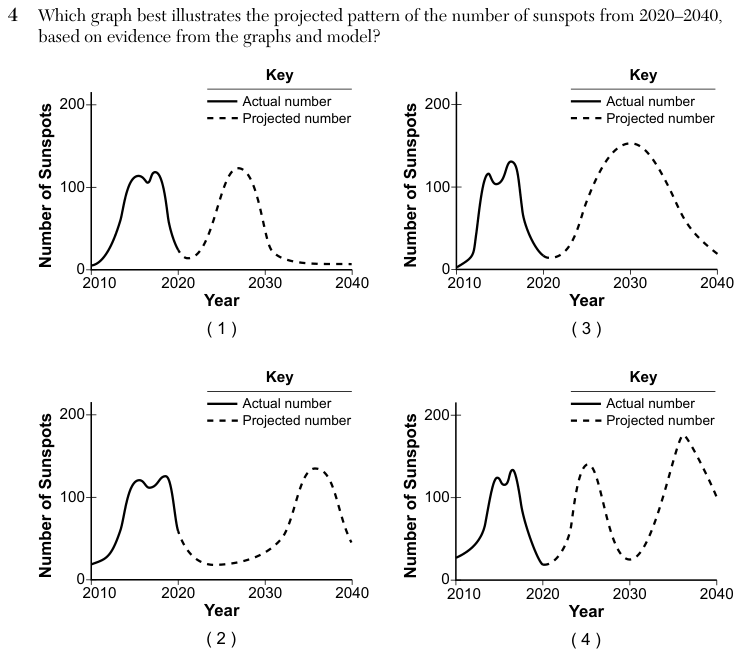
The context includes a graph of sunspot numbers from 1980 to 2020 with high points near 1980, 1990, 2001 and 2014 and low points near 1986, 1996, 2008 and 2019, and the passage states that scientists have identified an 11-year solar cycle. A second model plots sunspot numbers from 2008 to 2017, rising from near 0 to about 115 in 2014. Each of the four answer graphs has a key with a solid line for the actual number and a dashed line for the projected number, the same solid line from 2010 to 2020 (rising to about 115 to 130 near 2014 to 2016, then falling), and a different dashed line from 2020 to 2040. Graph 1: one dashed rise to about 120 near 2027, then about 5 from about 2032 to 2040. Graph 2: a dashed line near 20 from about 2022 to 2030, one rise to about 135 near 2036, then down to about 45 at 2040. Graph 3: one broad dashed rise to about 150 near 2030, then down to about 20 at 2040. Graph 4: a dashed rise to about 140 near 2025, a fall to about 25 near 2030, a rise to about 175 near 2036, then down to about 100 at 2040.
How to think about it
Use the 1980 to 2020 sunspot graph to measure the time from one high point to the next. Compare that spacing with the cycle length stated in the passage. Then picture the pattern repeating from the last low point near 2020 and find the dashed line that follows the same spacing.
Which graph best illustrates the projected pattern of the number of sunspots from 2020–2040, based on evidence from the graphs and model? Year 2010 2020 2030 2040 0 100 200 Number of Sunspots