Earth and Space Sciences Regents, January 2026, question 18
Tap an image to open it full size.
What the figure shows
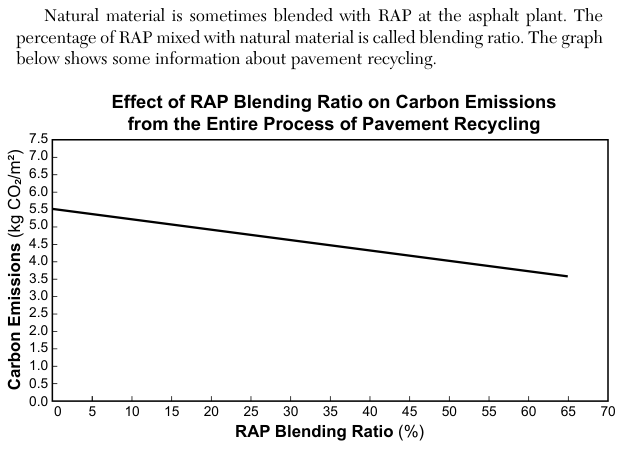
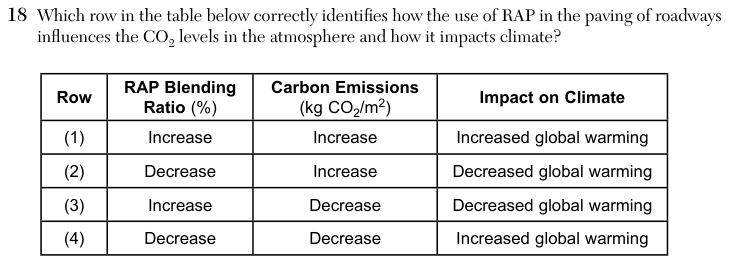
The passage says natural material is sometimes blended with recycled asphalt pavement (RAP), and the percentage of RAP in the mix is called the blending ratio. A line graph, Effect of RAP Blending Ratio on Carbon Emissions from the Entire Process of Pavement Recycling, plots RAP Blending Ratio (%) from 0 to 70 on the horizontal axis and Carbon Emissions in kilograms of carbon dioxide per square meter (kg CO2/m2) from 0 to 7.5 on the vertical axis. The straight line runs from about 5.5 kg CO2/m2 at 0% to about 3.6 kg CO2/m2 at 65%. The table in the question has columns for RAP Blending Ratio, Carbon Emissions and Impact on Climate.
How to think about it
Read the graph from left to right and note which way the line goes as the blending ratio grows. Then decide what happens to the climate when more or less carbon dioxide, a greenhouse gas, is released. All three columns of a row must agree with the graph and with each other.
Which row in the table below correctly identifies how the use of RAP in the paving of roadways influences the CO2 levels in the atmosphere and how it impacts climate? Row RAP Blending Ratio (%) Carbon Emissions (kg CO2/m2) Impact on Climate