Earth and Space Sciences Regents, January 2026, question 49
Tap an image to open it full size.
What the figure shows
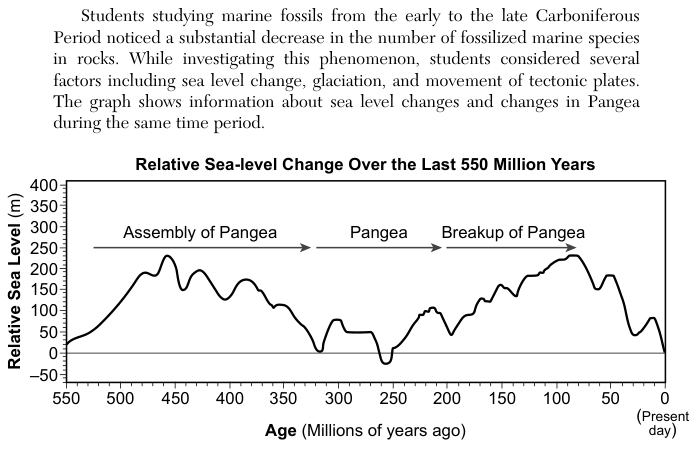
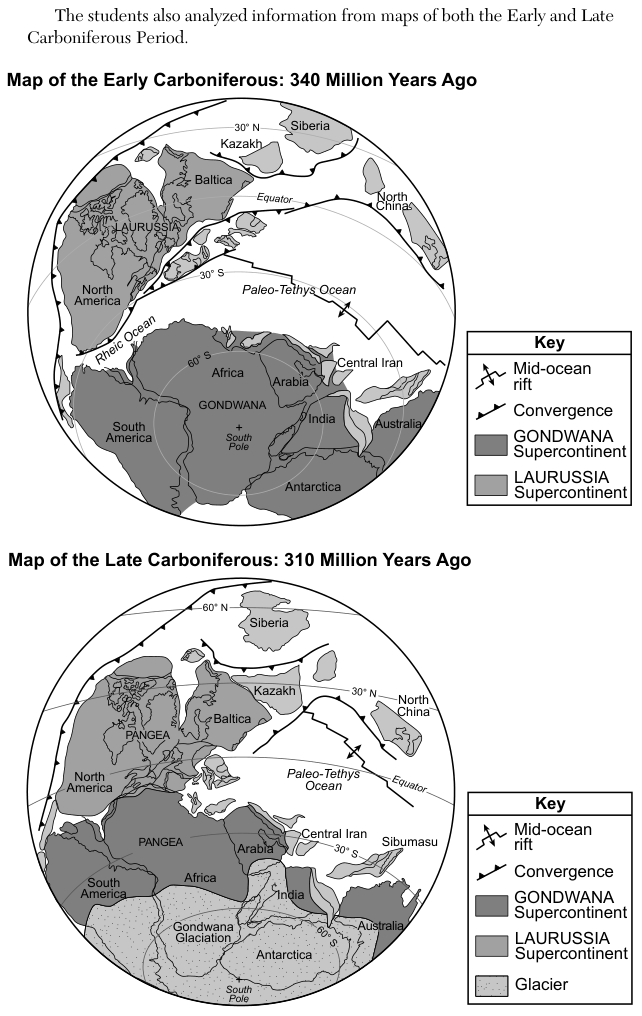
Students noticed that the number of fossil marine species fell from the early to the late Carboniferous Period, and made the claim: "A decrease of marine organisms from the early to the late Carboniferous Period is a result of sea level change and glaciation on Earth." A graph, Relative Sea-level Change Over the Last 550 Million Years, plots relative sea level in meters (m), from -50 to 400, against age from 550 million years ago to the present day; arrows mark the times of Assembly of Pangea, Pangea, and Breakup of Pangea. Two world maps show the Early Carboniferous at 340 million years ago and the Late Carboniferous at 310 million years ago. The map keys show mid-ocean rifts, convergence, and the Gondwana and Laurussia supercontinents; the 310 million year map also has a Glacier pattern, labeled Gondwana Glaciation, over Antarctica and nearby land around the South Pole.
How to think about it
Read the sea level curve at 340 million years ago and again at 310 million years ago, and note which way it moved. Then compare the two maps: check the keys and look for anything on the later map that is not on the earlier one. For each sphere, decide whether it gained or lost water between the two times.
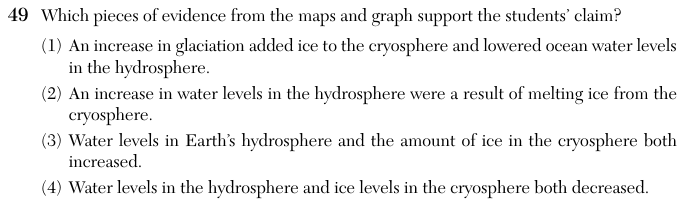
Which pieces of evidence from the maps and graph support the students’ claim?
Choice 1 is right. The 310 million year map shows a large Gondwana Glaciation that is not on the 340 million year map, so ice on land (part of the cryosphere) grew. The sea level curve is lower at 310 million years ago than at 340 million years ago. Water that becomes glacier ice on land is taken from the oceans (part of the hydrosphere), so sea level falls, shallow seas shrink, and marine organisms lose habitat.
This choice says ice melted and sea level rose. The maps show the opposite for ice: a glacier appears on the later map. The sea level curve also ends lower at 310 million years ago than it was at 340 million years ago.
Ice did increase, but sea level did not. Ice on land holds water that came from the oceans, so growing glaciers lower sea level. This choice may come from reading only the maps and not the sea level graph.
Sea level did fall, but ice did not decrease. The glacier shown on the 310 million year map is new. This choice may come from reading only the graph and not comparing the two maps.